The new year brought with it renewed market volatility. Following over 40% run-ups in the S&P 500 and MSCI All-Country World Indexes from their April 2025 lows through their 2026 peaks, stocks have given back some gains, and many country indices are now in correction territory (YCharts). Year-to-date, energy stocks have reigned supreme, with the S&P Energy Index up 38.8%. Conversely, consumer discretionary, financial, and technology stocks have lagged in 2026 thus far, with each sector index down over 10% from its most recent high (YCharts).
The weight of evidence suggests that the current equity market decline should be viewed as a short-term pullback within an ongoing, longer-term bull market. However, we are watching indicators closely for changes in global economic/market health. Below are five charts we will be paying special attention to in Q2.
Chart #1 – US Tariff Rates by Country
The Supreme Court ruled on February 20 against President Trump’s tariffs, noting that the International Emergency Economic Powers Act of 1977 does not, in fact, grant the president authority to impose tariffs on imported goods. This immediately halted most of Trump’s tariffs enacted in his second term and also opened the floodgates to business and consumer lawsuits seeking refunds for tariffs paid. However, on February 24, Trump enacted a global 10% tariff surcharge under Section 122 of the Trade Act of 1974 and hinted that he intends to raise the levy to 15% (the legal maximum) in short order.
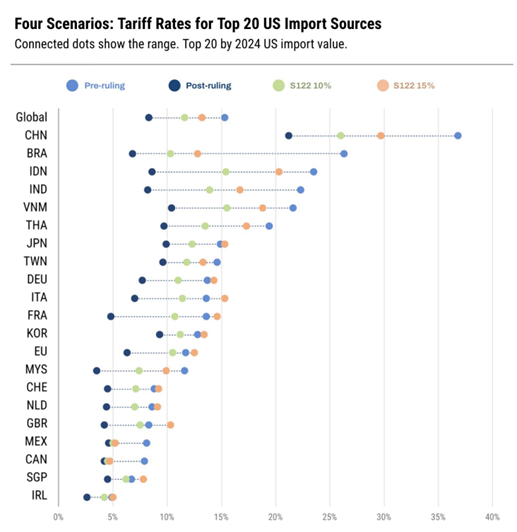
The Section 122 tariff “surcharges” are in addition to all other existing tariffs created as part of previous agreements, trade deals, etc. In other words, a 10% Section 122 tariff does not result in a 10% effective tariff rate but is a 10% tariff on top of other existing levies for a higher effective rate.
Source: YCharts
The chart above shows country-specific effective tariff rates pre- and post-ruling, with the current 10% Section 122 tariff surcharges, and then with potential 15% levies. In almost all cases, the current Section 122 levies have been far less than the rates prior to the Supreme Court ruling.
Based on market reactions, investors are not worked up about Section 122 tariffs, even if they increase to 15%, as these tariffs are only allowed to be in place for 150 days. Trump’s team is exploring other ways to enact larger and longer-lasting tariffs without congressional approval, but the Supreme Court ruling has significantly diminished the chance of large tariffs impacting the economy in the near term.
Chart #2 – The $165B Refund Question
As mentioned before, the government is facing countless lawsuits seeking refunds of the roughly $165B in tariff revenue collected under the now unconstitutional tariffs. Processing these refunds could be messy, and in Treasury Secretary Scott Bessent’s words, it “. . . could be dragged out for weeks, months, years, so . . . we’ll see what happens there.” Still, $165B due to taxpayers could be economically stimulative, coming to just over $600 per taxpayer if divided equally among the adult population. In practice, we think a national “tariff dividend” will be the way tariffs are ultimately refunded, rather than through individual lawsuits, with payments influenced by factors like income and/or household size.
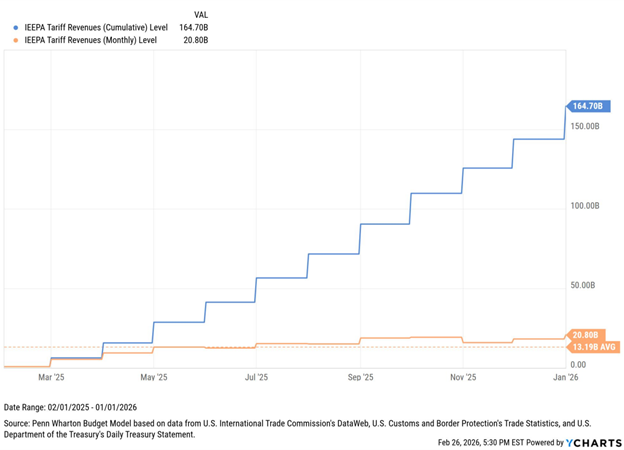
Presumably, tariff refunds will be paid with borrowed money, stimulating the economy but adding to the already ballooning federal debt.
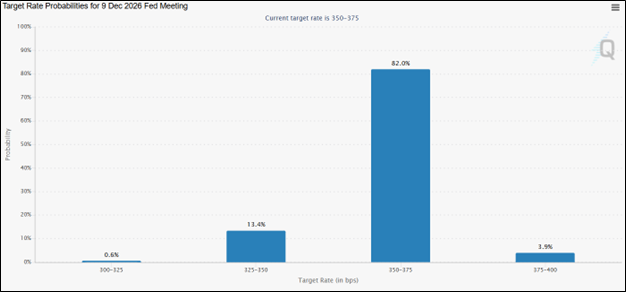
Chart #3 – No More Interest Rate Cuts in 2026
As a result of the Iran conflict, near-term inflation expectations have shifted higher. Federal Reserve board members have also expressed concern over inflation, increasing their forecasts for the year. As a result, expectations have shifted from one more rate cut in 2026 to zero rate cuts, and a slim possibility of a rate hike. The chart below shows the probabilities of where the benchmark Federal Funds Interest Rate will be by December. These probabilities are derived from the futures market, where investors bet on the future path of interest rate hikes. The current benchmark range is 3.50%–3.75%.
Source: CME Group
The Federal Reserve usually hesitates to hike due to energy prices alone, preferring broader inflation metrics such as the Personal Consumption Expenditures price index as a guide for setting policy. A rate hike, in our opinion, seems unlikely, but a scenario with prolonged combat and persistently high energy prices could trigger broader-based inflation, providing impetus for potential rate increases.
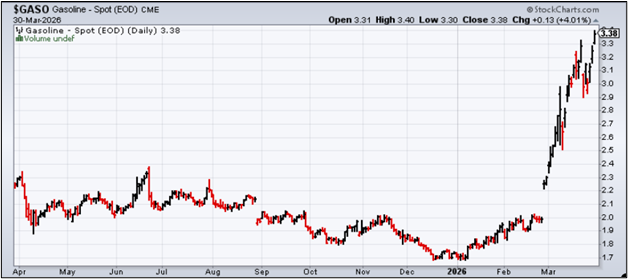
Chart #4 – Watch Wholesale Gasoline Prices for the Complete Picture
The conflict in Iran has brought the price of oil to the forefront. “$100 a barrel” is a memorable headline, but oil prices only tell part of the story. Bombing and strikes in the Middle East have damaged not only regional oil extraction facilities, but also the refineries that turn crude oil into usable products such as jet fuel and gasoline. By capturing the reduction of refining capacity, wholesale gasoline prices better measure the economic damage caused by the Middle East conflict than crude oil alone.
Source: StockCharts
Current wholesale gasoline prices are $3.38/gallon and are unlikely to fall significantly without a sustainable ceasefire.
Chart #5 – When in Doubt, Zoom Out
Global stocks remain muddled in a pullback, marking the largest decline since the March 2025 “tariff tantrum.” The collective fear now is that fighting in the Middle East will escalate and drag on, causing prolonged energy inflation, which will choke off the global economy. Our opinion runs counter to this – that Americans, and therefore Trump, do not want an “Afghanistan/Iraq 2.0” or high gasoline prices into the election. In fact, repeated comments from Trump and his team indicating that fighting will be over soon and that Iran is “begging for a deal” suggest that he’s seeking an off-ramp to end the operation sooner rather than later.
Even if we’re wrong, and fighting continues for months on end, it takes a lot to squeeze the global economy into recession. After all, we’re talking about corporations whose sole purpose for existing is to make money. And based on over 100 years of history, companies tend to be quite adept at generating profits, even in challenging economic environments.
That said, we are keenly aware of the risks of war and higher energy prices, especially when considering the weakening state of the labor market. Our four proprietary, quantitative tactical systems that are designed to identify business cycle turning points are always guiding us on near-term market and economic risk. And at this point, they are not suggesting recent global events will cause a larger recessionary bear market. In fact, they show that further market sell-offs should likely be viewed as buying opportunities.
Keeping our finger on the pulse of the market is always important, but is especially critical during turbulent times. We will continue to examine and analyze the facts, risks, and data, and let empiricism guide our investment decisions. As always, we are here for you to discuss all things financial and welcome your calls at (412) 465-1490. Happy spring, Easter, and Passover, and we look forward to speaking with you soon.
Spring 2026 Market Insights: 5 Charts We’re Watching
The new year brought with it renewed market volatility. Following over 40% run-ups in the S&P 500 and MSCI All-Country World Indexes from their April 2025 lows through their 2026 peaks, stocks have given back some gains, and many country indices are now in correction territory (YCharts). Year-to-date, energy stocks have reigned supreme, with the S&P Energy Index up 38.8%. Conversely, consumer discretionary, financial, and technology stocks have lagged in 2026 thus far, with each sector index down over 10% from its most recent high (YCharts).
The weight of evidence suggests that the current equity market decline should be viewed as a short-term pullback within an ongoing, longer-term bull market. However, we are watching indicators closely for changes in global economic/market health. Below are five charts we will be paying special attention to in Q2.
Chart #1 – US Tariff Rates by Country
The Supreme Court ruled on February 20 against President Trump’s tariffs, noting that the International Emergency Economic Powers Act of 1977 does not, in fact, grant the president authority to impose tariffs on imported goods. This immediately halted most of Trump’s tariffs enacted in his second term and also opened the floodgates to business and consumer lawsuits seeking refunds for tariffs paid. However, on February 24, Trump enacted a global 10% tariff surcharge under Section 122 of the Trade Act of 1974 and hinted that he intends to raise the levy to 15% (the legal maximum) in short order.
The Section 122 tariff “surcharges” are in addition to all other existing tariffs created as part of previous agreements, trade deals, etc. In other words, a 10% Section 122 tariff does not result in a 10% effective tariff rate but is a 10% tariff on top of other existing levies for a higher effective rate.
Source: YCharts
The chart above shows country-specific effective tariff rates pre- and post-ruling, with the current 10% Section 122 tariff surcharges, and then with potential 15% levies. In almost all cases, the current Section 122 levies have been far less than the rates prior to the Supreme Court ruling.
Based on market reactions, investors are not worked up about Section 122 tariffs, even if they increase to 15%, as these tariffs are only allowed to be in place for 150 days. Trump’s team is exploring other ways to enact larger and longer-lasting tariffs without congressional approval, but the Supreme Court ruling has significantly diminished the chance of large tariffs impacting the economy in the near term.
Chart #2 – The $165B Refund Question
As mentioned before, the government is facing countless lawsuits seeking refunds of the roughly $165B in tariff revenue collected under the now unconstitutional tariffs. Processing these refunds could be messy, and in Treasury Secretary Scott Bessent’s words, it “. . . could be dragged out for weeks, months, years, so . . . we’ll see what happens there.” Still, $165B due to taxpayers could be economically stimulative, coming to just over $600 per taxpayer if divided equally among the adult population. In practice, we think a national “tariff dividend” will be the way tariffs are ultimately refunded, rather than through individual lawsuits, with payments influenced by factors like income and/or household size.
Presumably, tariff refunds will be paid with borrowed money, stimulating the economy but adding to the already ballooning federal debt.
Chart #3 – No More Interest Rate Cuts in 2026
As a result of the Iran conflict, near-term inflation expectations have shifted higher. Federal Reserve board members have also expressed concern over inflation, increasing their forecasts for the year. As a result, expectations have shifted from one more rate cut in 2026 to zero rate cuts, and a slim possibility of a rate hike. The chart below shows the probabilities of where the benchmark Federal Funds Interest Rate will be by December. These probabilities are derived from the futures market, where investors bet on the future path of interest rate hikes. The current benchmark range is 3.50%–3.75%.
Source: CME Group
The Federal Reserve usually hesitates to hike due to energy prices alone, preferring broader inflation metrics such as the Personal Consumption Expenditures price index as a guide for setting policy. A rate hike, in our opinion, seems unlikely, but a scenario with prolonged combat and persistently high energy prices could trigger broader-based inflation, providing impetus for potential rate increases.
Chart #4 – Watch Wholesale Gasoline Prices for the Complete Picture
The conflict in Iran has brought the price of oil to the forefront. “$100 a barrel” is a memorable headline, but oil prices only tell part of the story. Bombing and strikes in the Middle East have damaged not only regional oil extraction facilities, but also the refineries that turn crude oil into usable products such as jet fuel and gasoline. By capturing the reduction of refining capacity, wholesale gasoline prices better measure the economic damage caused by the Middle East conflict than crude oil alone.
Source: StockCharts
Current wholesale gasoline prices are $3.38/gallon and are unlikely to fall significantly without a sustainable ceasefire.
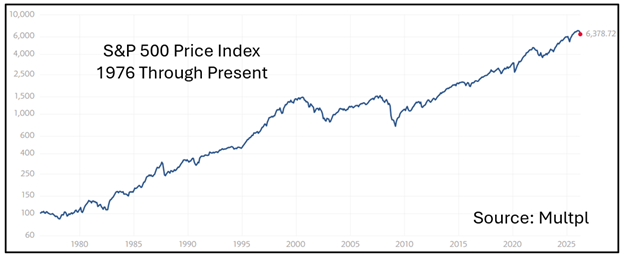
Chart #5 – When in Doubt, Zoom Out
Global stocks remain muddled in a pullback, marking the largest decline since the March 2025 “tariff tantrum.” The collective fear now is that fighting in the Middle East will escalate and drag on, causing prolonged energy inflation, which will choke off the global economy. Our opinion runs counter to this – that Americans, and therefore Trump, do not want an “Afghanistan/Iraq 2.0” or high gasoline prices into the election. In fact, repeated comments from Trump and his team indicating that fighting will be over soon and that Iran is “begging for a deal” suggest that he’s seeking an off-ramp to end the operation sooner rather than later.
Even if we’re wrong, and fighting continues for months on end, it takes a lot to squeeze the global economy into recession. After all, we’re talking about corporations whose sole purpose for existing is to make money. And based on over 100 years of history, companies tend to be quite adept at generating profits, even in challenging economic environments.
That said, we are keenly aware of the risks of war and higher energy prices, especially when considering the weakening state of the labor market. Our four proprietary, quantitative tactical systems that are designed to identify business cycle turning points are always guiding us on near-term market and economic risk. And at this point, they are not suggesting recent global events will cause a larger recessionary bear market. In fact, they show that further market sell-offs should likely be viewed as buying opportunities.
Keeping our finger on the pulse of the market is always important, but is especially critical during turbulent times. We will continue to examine and analyze the facts, risks, and data, and let empiricism guide our investment decisions. As always, we are here for you to discuss all things financial and welcome your calls at (412) 465-1490. Happy spring, Easter, and Passover, and we look forward to speaking with you soon.
Join Our Mailing List